Lethe044/hermes-incident-commander
Autonomous SRE agent that detects, diagnoses, and self-heals production incidents - with a standalone watchdog that needs no Hermes install, just an Anthropic API key. Memory + Skills + Cron + Gateway + Subagents + Atropos RL.
Hermes Incident Commander is an autonomous SRE agent designed to detect, diagnose, and remediate production infrastructure incidents. It operates either as a plugin for Hermes Agent or as a standalone watchdog on Linux hosts using an Anthropic API key to provide triage and automated healing.
- Monitors CPU, memory, disk, and failed systemd units.
- Supports automated remediation and adaptive, time-of-day-aware thresholds.
- Integrates with PagerDuty, Slack, Discord, and Microsoft Teams.
full readme from github
⚕ Hermes Incident Commander


An autonomous SRE agent that detects, diagnoses, and heals production infrastructure - then learns from every incident it resolves.
Originally built on Hermes Agent by NousResearch for the "Show us what Hermes Agent can do" hackathon. Now also ships a standalone watchdog that runs on any real Linux host with nothing but an Anthropic API key - no Hermes installation required.
What's New
- 💬 Microsoft Teams notification channel -
TEAMS_WEBHOOK_URLposts a MessageCard, colored by severity, alongside Discord/Slack/PagerDuty/the generic webhook. - 📊 Flapping/quiet-hours Prometheus gauges -
hermes_watchdog_flappingandhermes_watchdog_in_quiet_hourson/metrics, so an existing Grafana/Prometheus stack can show the same suppression state the dashboard and reports already do. - ⏰ Scheduled
--prunevia the systemd installer -install-watchdog.sh --with-prune-timersets up a daily systemd timer that runsincident_db.py --prune --yes, so retention doesn't need a manual or cron-it-yourself step. - 🗄️
--prune --archive DIR- move old report files to cold storage instead of deleting them outright (the SQLite/history rows are removed from the active index either way). - 🧹
incident_db.py --prune- removes incidents older than--older-than-days(report file, SQLite row, andhistory.jsonlline), dry-run by default,--yesto actually delete - keeps disk usage bounded on long-running installs. - ⏳ "Still ongoing" notification after quiet hours end - if a breach starts during a quiet-hours window and is still active once the window closes, the very next poll sends one notification noting how long it's been running, instead of staying silent until an unrelated later poll happens to notice.
- 🧩 Configurable generic-webhook payload template -
GENERIC_WEBHOOK_TEMPLATElets the generic webhook match any target JSON shape (Discord embeds, a custom internal schema, ...) via{source}/{title}/{message}/{severity}placeholders, with no brace-escaping needed even for deeply nested JSON. - ⬇️ Download CSV button in the offline dashboard - exports exactly what's currently visible in the incidents table (respects an active search or category-chart filter), client-side, no server.
- 🔕 Quiet hours / maintenance windows - configure recurring daily UTC
windows (e.g. a known nightly batch job) during which breaches are still
detected, reported, and indexed as normal, but the outbound notification
is suppressed. Validated by
--validate-configtoo. - 🌐 Generic webhook notification channel -
GENERIC_WEBHOOK_URLposts a small, stable JSON body (source,title,message,severity) to any endpoint, for platforms without first-class support here (Opsgenie, Microsoft Teams via a relay, an internal tool). - 🖱️ Clickable category chart in the offline dashboard - click a bar in "Incidents by Category" to filter the recent-incidents table to that category, reusing the existing search box's filtering logic.
- 📤
incident_db.py --stats --format csv- the severity/category breakdown as a flat CSV, easy to chart in a spreadsheet. - 💡 Flapping incidents now suggest a concrete threshold fix - instead
of just repeating "this is flapping," the report proposes a specific new
cpu_threshold/mem_threshold/disk_thresholdvalue (learned from--adaptive-thresholdsbaseline data when available, otherwise a conservative bump) - and the watchdog throttles repeat notifications for the same ongoing flap so you're not paged over and over for the same known issue. - 📊
incident_db.py --stats- total incidents, breakdown by severity and category, auto-remediation rate, incidents in the last 7/30 days, and the busiest category, as text or--format json. - 🗂️ Category breakdown chart in the offline dashboard - a horizontal bar chart of incident counts by category, next to the severity and trend charts.
- 🐛 Fixed a real path-isolation bug in
flapping.py,baseline.py, andincident_db.py: their default file-path arguments were bound at import time, so tests (or any other caller) patching the module-level path constant after import were silently ignored and could write to the real~/.hermes/incidents/instead of the intended location. Paths are now resolved fresh on every call. - 📈 Trend chart in the offline dashboard - a 14-day incidents-per-day line chart (still a hand-rolled SVG, no chart.js) sits next to the severity breakdown so "is this getting better or worse" is visible at a glance.
- ✅
--validate-config- checks awatchdog_config.yamlfor typos (unrecognized keys), out-of-range thresholds, and invalid allow-list entries, prints the resolved config, and exits - without starting the watchdog. Complements--dry-run, which validates behavior against live metrics rather than the config file itself. - 📤 CSV/JSON export from
incident_db.py --search---format jsonor--format csvalongside the default human-readable text, so a search can be piped straight into a weekly incident-review report. - 🔎 Search box in the offline dashboard - filter incidents by severity, category, root cause, or report filename, client-side, no server.
- 🔁 Notifier retry/backoff - a transient network blip during a real incident no longer means the page silently never goes out.
- 🌀 Flapping detection - 3+ incidents of the same category within an hour get flagged in the report, the console, and the dashboard instead of repeating silently forever.
- 🛠️
scripts/install-watchdog.sh- one-command systemd install for the watchdog. Dry-run by default; safe by design. See Standalone Mode. - 🔍 Local incident search -
monitor/incident_db.pybuilds a SQLite + full-text-search index over your incident history, auto-updated after every incident. No server, no new dependency. - 📅 Adaptive, time-of-day-aware thresholds -
--adaptive-thresholdslearns a per-hour baseline so a predictable nightly batch job doesn't page you, while still catching real anomalies. Opt-in; can only raise the bar above your configured threshold, never lower it. - ☁️ 10 incident scenarios total - including Docker, Kubernetes, ECS, and Lambda, alongside the original service/disk/memory/CPU/network ones.
- 📈 Prometheus
/metrics+ a ready-to-import Grafana dashboard JSON, and a--dry-runmode to preview--auto-remediatebefore trusting it. - 📟 PagerDuty integration (trigger + auto-resolve), alongside Discord/Slack, with zero new dependencies.
- 🛰️ Standalone Watchdog - monitor a real host's CPU/memory/disk and failed systemd units, get Claude-powered triage, and (opt-in) safe auto-remediation. No Hermes install needed.
- 📊 Offline HTML Dashboard, CI on every push, a written SAFETY.md threat model, and a living ROADMAP.md.
Full history in CHANGELOG.md · what's coming in ROADMAP.md.
The Problem
When a production server goes down at 3 AM, an on-call engineer has to:
- Wake up, check alerts
- SSH in, run diagnostics manually
- Piece together root cause from logs
- Apply a fix - hopefully the right one
- Verify it worked
- Write a post-mortem nobody will read
Mean time to resolve (MTTR) for P0 incidents averages 45–60 minutes. Much of that is humans doing things a sufficiently capable agent could do faster and better.
Hermes Incident Commander does all of it - autonomously, in minutes, getting smarter with each incident it handles.
Demo
# Install dependencies
pip install anthropic rich

# Set your API key
export ANTHROPIC_API_KEY=sk-ant-...

# Run a demo incident (disk full scenario)
python demo/demo_incident.py --scenario disk-full-logs

# Try other scenarios
python demo/demo_incident.py --scenario svc-crash-nginx
python demo/demo_incident.py --scenario cpu-runaway-process
What you'll see:
- Hermes detects the incident and classifies severity (P0/P1/P2/P3)
- Runs parallel diagnostics across CPU, memory, disk, and services
- Identifies root cause with explicit reasoning
- Applies the safest effective fix
- Verifies the fix worked
- Writes a structured post-incident report to
~/.hermes/incidents/ - Creates a new prevention skill in
~/.hermes/skills/so it handles this faster next time
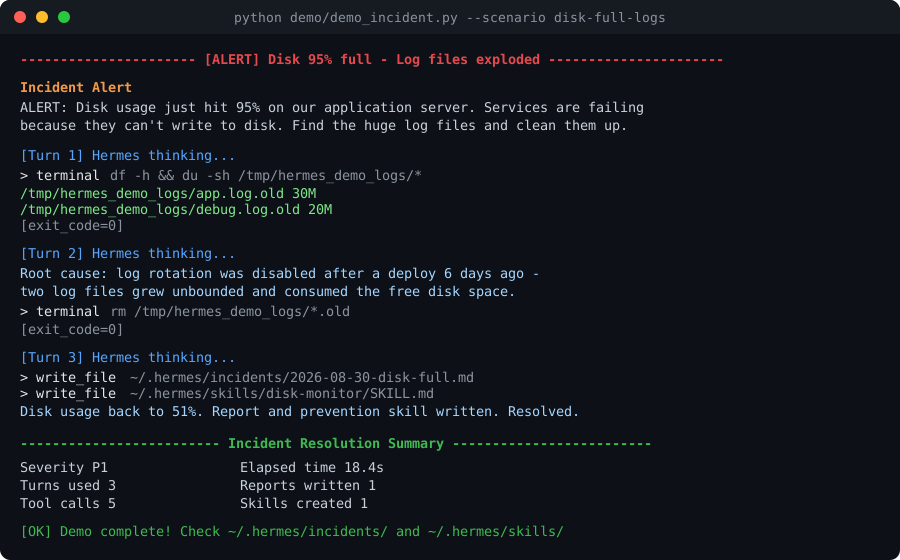
Illustrative example of what a run looks like - hand-assembled from real transcript shapes, not a captured live session (turn count, timings, and exact tool calls will vary run to run).
⚠️ The demo and the RL training environment give the model full terminal access. Only run them in a disposable sandbox/VM/container - see SAFETY.md.
Standalone Mode (No Hermes Required)
You don't need a Hermes Agent installation to get real value out of this
project. monitor/watchdog.py runs as an always-on process on any Linux host
and needs nothing but ANTHROPIC_API_KEY:
pip install -e .              # or: pip install -r requirements.txt psutil

export ANTHROPIC_API_KEY=sk-ant-...
# optional, for real-time alerts (any subset - all can be set at once):
export DISCORD_WEBHOOK_URL=https://discord.com/api/webhooks/...
export SLACK_WEBHOOK_URL=https://hooks.slack.com/services/...
export TEAMS_WEBHOOK_URL=https://outlook.office.com/webhook/...
export PAGERDUTY_ROUTING_KEY=...
export GENERIC_WEBHOOK_URL=...        # any endpoint that accepts a JSON POST
export GENERIC_WEBHOOK_TEMPLATE='{"text": {message}}'   # optional - match a specific target's schema

# Single check - good for testing or a cron job
python -m monitor.watchdog --once

# Preview what --auto-remediate would do, without doing it
python -m monitor.watchdog --dry-run

# Continuous monitoring (observe-only by default)
python -m monitor.watchdog --cpu-threshold 85 --interval 30

# Opt in to SAFE, allow-listed auto-remediation (see monitor/watchdog_config.example.yaml)
python -m monitor.watchdog --config monitor/watchdog_config.yaml --auto-remediate

# Also serve Prometheus-format metrics at http://127.0.0.1:9877/metrics
python -m monitor.watchdog --metrics-port 9877

# Learn a per-hour baseline so a predictable nightly batch job doesn't page you
python -m monitor.watchdog --adaptive-thresholds
python -m monitor.watchdog --show-baseline

# Search past incidents ("have we seen this before?") - no server, just SQLite
python -m monitor.incident_db --sync
python -m monitor.incident_db --search "nginx"
python -m monitor.incident_db --search "nginx" --format json     # or --format csv
python -m monitor.incident_db --stats                            # or --format json/csv
python -m monitor.incident_db --prune --older-than-days 90       # dry run
python -m monitor.incident_db --prune --older-than-days 90 --yes # actually remove
python -m monitor.incident_db --prune --older-than-days 90 --archive /backup/incidents --yes

# Check a config file for typos/invalid allow-list entries before using it
python -m monitor.watchdog --config monitor/watchdog_config.yaml --validate-config

# One-command systemd install (dry-run by default - see exactly what it would do)
./scripts/install-watchdog.sh
sudo ./scripts/install-watchdog.sh --yes --auto-remediate --adaptive-thresholds
sudo ./scripts/install-watchdog.sh --yes --with-prune-timer --prune-older-than-days 90
Unlike the demo/training environment, the watchdog never gives the model
shell access. It collects real metrics with psutil, sends only numbers to
Claude, and any remediation is restricted to an explicit allow-list you
configure (restart this specific service, clean this specific log
directory). Full threat model in SAFETY.md. --dry-run runs one
check and prints exactly what would be restarted or deleted (prefixed
[DRY RUN]) without doing it or notifying anyone - a safe way to validate a
new watchdog_config.yaml before turning --auto-remediate on for real.
--adaptive-thresholds (monitor/baseline.py) learns a running mean/stddev
per hour-of-day from the watchdog's own polls. It can only ever raise
the effective threshold above what you configured - never lower it - and is
capped at 1.5x your static threshold, so a real ongoing incident can't
slowly train the watchdog into ignoring itself. It's off by default; nothing
changes unless you opt in.
monitor/notifier.py fans an alert out to every channel you've configured -
Discord, Slack, Microsoft Teams, a generic webhook, and/or PagerDuty (via
the Events API v2) - so it's safe to set all of them; nothing extra fires
for channels you leave unconfigured. When PagerDuty is configured, the
watchdog also tracks which breach types have an open incident and calls
PagerDuty's resolve endpoint automatically once things recover, instead of
leaving pages open forever. Delivery to any channel now retries transient
failures (timeouts, connection drops, HTTP 429/5xx) with exponential
backoff, so a brief network blip during a real incident doesn't mean the
page silently never arrives.
If the same category of incident fires 3+ times within an hour,
monitor/flapping.py flags it - a "⚠️ FLAPPING DETECTED" banner at the top
of the report, a console warning, and a badge in the dashboard - since
that's usually either a root cause that isn't actually fixed, or a
threshold tuned too tight for normal load. For cpu/mem/disk, the banner
also proposes a concrete new threshold (suggest_threshold() - a learned
--adaptive-thresholds baseline value when trusted data exists, otherwise
a conservative bump) instead of just repeating the warning forever. Once a
category has crossed the flapping threshold and been alerted on once, the
watchdog throttles further Discord/Slack/PagerDuty/webhook notifications
for that same ongoing flap - the report and history.jsonl still record
every occurrence, only the repeat page is suppressed.
The same suppression applies during a configured quiet hours window -
a recurring daily UTC time range (e.g. a known nightly batch job) set via
quiet_hours in the config:
quiet_hours:
  - start: "02:00"
    end: "03:00"          # daily, every day
  - start: "23:00"
    end: "05:00"
    days: [sat, sun]       # only Saturday and Sunday nights
Breaches inside a quiet-hours window are still detected, written to the
report, and indexed as normal - only the outbound notification is
suppressed, which is different from --dry-run (which also skips
auto-remediation and PagerDuty bookkeeping entirely). If a breach is still
active once the window closes, the next poll sends one notification
noting how long it's been running - "silent during quiet hours" doesn't
mean "silent forever" if the problem outlasts the maintenance window.
Every incident is also indexed by monitor/incident_db.py (SQLite, with a
full-text search index when your Python's SQLite has FTS5 - falling back to
a plain LIKE scan otherwise) so "have we seen this before?" works without
a full Hermes install. write_incident() keeps it in sync automatically;
--sync/--search are there for manual use or a cron job, --format json/--format csv let you pipe a search straight into another tool or a
weekly incident-review report instead of only reading it on screen,
--stats (also --format json/--format csv) prints a quick summary
(totals, by severity/category, auto-remediation rate, last 7/30 days,
busiest category), and --prune --older-than-days N (dry-run unless
--yes) removes old incidents - their report file, SQLite row, and
history.jsonl line - so a long-running install doesn't grow INCIDENT_DIR
forever.
Before trusting a new watchdog_config.yaml, run --validate-config: it
flags unrecognized keys (a likely typo), thresholds outside 0-100,
negative intervals, malformed quiet_hours windows, and allow-list entries
that don't actually match anything (like a restart_services entry for a
service that isn't in watched_services) - then prints the fully resolved
config and exits, without starting the watchdog.
Want it running on boot without setting up the systemd unit by hand?
scripts/install-watchdog.sh does that in
one command - dry-run by default, and it writes your API key/secrets to a
root-only file rather than into the unit file itself. Add
--with-prune-timer to also install a daily systemd timer that runs
incident_db.py --prune --yes (--prune-older-than-days to change the
threshold, default 90), so retention doesn't need a manual/cron-it-yourself
step. --uninstall --yes removes everything this installed, watchdog
service and prune timer alike.
Once you have some incident history, generate a dashboard:
python -m monitor.dashboard --open
This writes a single, self-contained HTML file (no server, no external requests) summarizing incident counts by severity and category (click a category bar to filter the table below to it), a 14-day incidents-per-day trend, auto-remediation rate, and a searchable recent-incidents table with a "Download CSV" button that exports exactly what's currently visible (respects an active search or category filter), client-side, no server round-trip.
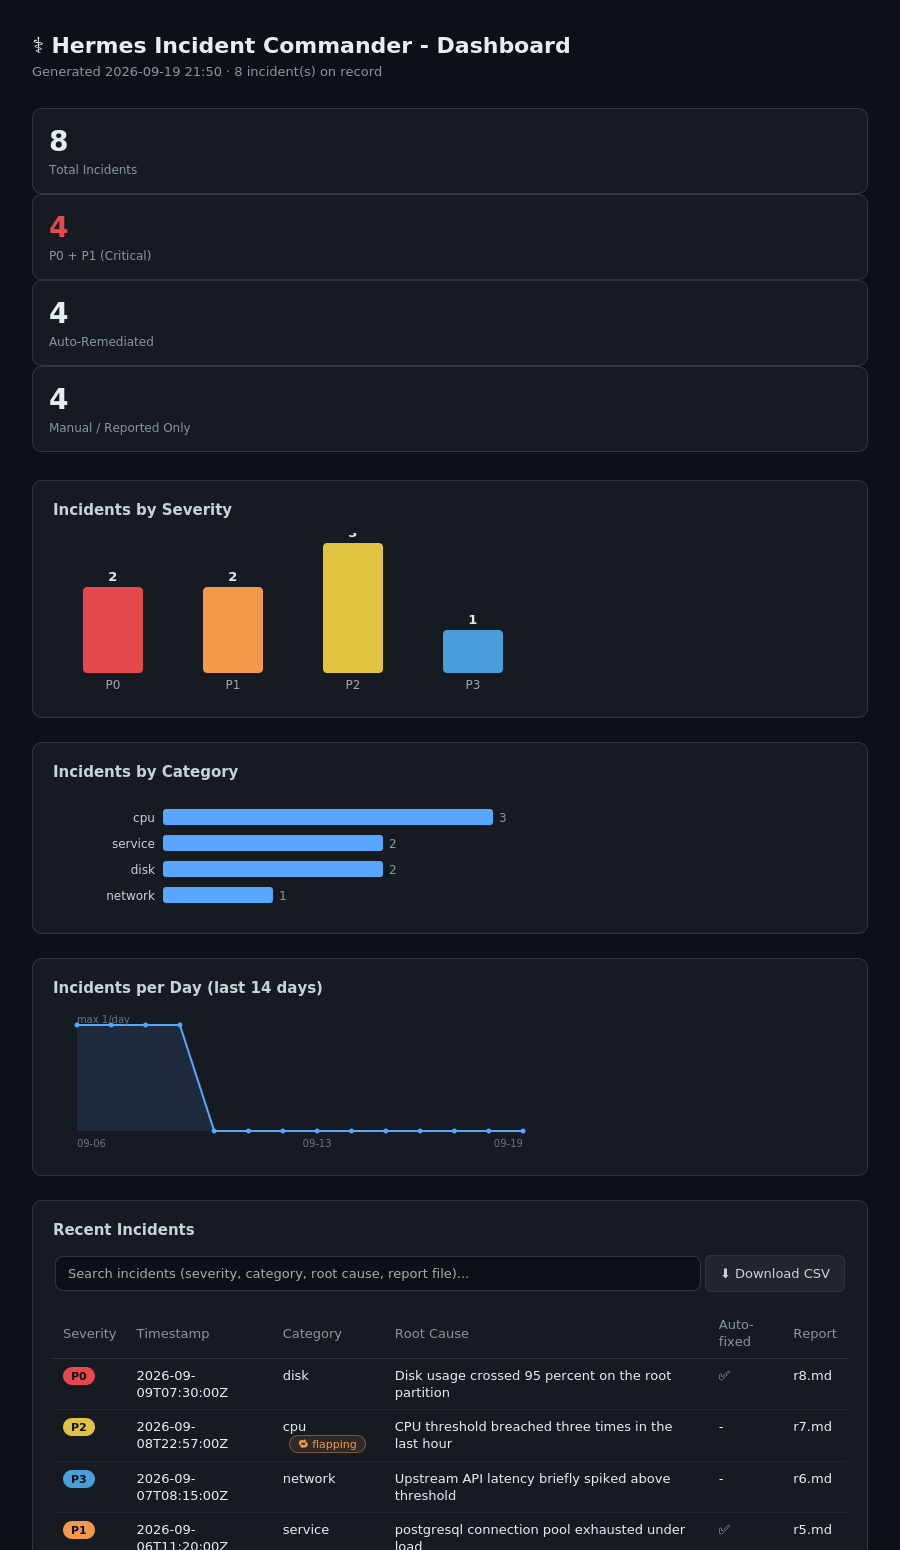
Real output of monitor/dashboard.py - rendered from sample incident history (including the category breakdown, 14-day trend chart, search box with CSV export, and a flapping badge), not a mockup.
If you already run Prometheus and Grafana, you can scrape the watchdog
directly instead of (or alongside) the dashboard - --metrics-port starts a
tiny, dependency-free /metrics endpoint (monitor/prometheus_exporter.py)
exposing hermes_watchdog_cpu_percent, hermes_watchdog_mem_percent,
hermes_watchdog_disk_percent, hermes_watchdog_failed_services_count,
a hermes_watchdog_breach{metric="..."} gauge per tracked metric, and
hermes_watchdog_flapping/hermes_watchdog_in_quiet_hours reflecting the
current incident's suppression state. It binds to 127.0.0.1 by default
and is read-only - it cannot be used to control the watchdog. Import
docs/assets/grafana-dashboard.json
into Grafana to get CPU/memory/disk gauges and a breach timeline without
building panels by hand.
How It Uses Every Hermes Feature
This project was designed to push every capability of Hermes Agent:
| Hermes Feature | How It's Used |
|---|---|
| Persistent Memory | Builds a system topology map over time. Learns which services fail together, time-of-day patterns, and which remediations work on YOUR infrastructure. |
| Skill Auto-Creation | After every novel incident, writes a new SKILL.md prevention playbook. Hermes gets measurably better at your stack over weeks. |
| Cron Scheduler | Every 5 min: critical health check. Every hour: full audit. Daily 08:00: morning briefing to Telegram. |
| Gateway (Telegram/Discord/PagerDuty) | Real-time P0 alerts, resolution notices, and daily briefings delivered to your phone or on-call rotation. |
| Subagent Spawning | For multi-service environments, spawns parallel subagents to investigate nginx, database, and application layers simultaneously. |
| Session Search (FTS5) | "Have we seen this error before?" - searches past incidents for matching patterns. |
| execute_code | Collapses multi-step diagnostic pipelines into single inference turns, dramatically reducing latency. |
| MCP Integration | Connects to cloud provider APIs (AWS/GCP/Azure MCP servers) for auto-scaling and cloud-native remediation. |
Architecture
flowchart TD
    ALERT([🚨 Incident Alert]) --> DETECT

    DETECT["🔍 DETECT<br/>Gather system vitals<br/>CPU • Memory • Disk • Services"]
    TRIAGE["⚖️ TRIAGE<br/>Classify severity<br/>P0 · P1 · P2 · P3"]
    DIAGNOSE["🔬 DIAGNOSE<br/>Root cause analysis<br/>Logs · Processes · Stack traces"]
    REMEDIATE["🔧 REMEDIATE<br/>Apply safest fix<br/>Tier 1 → 2 → 3"]
    VERIFY["✅ VERIFY<br/>Confirm resolution<br/>Before vs after metrics"]

    DETECT --> TRIAGE --> DIAGNOSE --> REMEDIATE --> VERIFY

    CRON["⏱️ CRON<br/>Every 5 min: health check<br/>Every hour: full audit<br/>Daily 08:00: briefing"]
    CRON -->|triggers| DETECT

    LEARN["🧠 LEARN<br/>Write post-incident report<br/>Create prevention SKILL.md<br/>Update MEMORY.md<br/>Search past incidents (FTS5)"]
    VERIFY --> LEARN

    GATEWAY["📲 GATEWAY<br/>Telegram · Discord · Slack"]
    TRIAGE -->|"🚨 P0/P1 alert"| GATEWAY
    VERIFY -->|"✅ resolved"| GATEWAY
    CRON -->|"📋 daily briefing"| GATEWAY

    style DETECT fill:#1e3a5f,color:#fff
    style TRIAGE fill:#7b2d00,color:#fff
    style DIAGNOSE fill:#1e3a5f,color:#fff
    style REMEDIATE fill:#1a4731,color:#fff
    style VERIFY fill:#1a4731,color:#fff
    style LEARN fill:#3d2068,color:#fff
    style CRON fill:#2d2d2d,color:#fff
    style GATEWAY fill:#2d2d2d,color:#fff
    style ALERT fill:#7b2d00,color:#fff
Project Structure
graph LR
    ROOT["📁 hermes-incident-commander"]

    ROOT --> SKILLS["📁 skills/"]
    ROOT --> ENVS["📁 environments/"]
    ROOT --> DEMO["📁 demo/"]
    ROOT --> MON["📁 monitor/"]
    ROOT --> SCRIPTS["📁 scripts/"]
    ROOT --> TESTS["📁 tests/"]
    ROOT --> DOCS["📁 docs/"]
    ROOT --> CI["📁 .github/workflows/"]
    ROOT --> REQ["📄 requirements.txt · pyproject.toml"]

    SKILLS --> SKILL_MD["📄 incident-commander/SKILL.md<br/>← install into ~/.hermes/skills/"]

    ENVS --> ENV_PY["🐍 incident_env.py<br/>← Atropos RL environment, 10 scenarios"]
    ENVS --> ENV_CFG["⚙️ incident_config.yaml<br/>← training configuration"]

    DEMO --> DEMO_PY["🐍 demo_incident.py<br/>← standalone sandboxed demo"]

    MON --> WATCHDOG["🐍 watchdog.py<br/>← real-host monitor, no Hermes needed"]
    MON --> NOTIFY["🐍 notifier.py<br/>← Discord / Slack / PagerDuty, with retry"]
    MON --> DASH["🐍 dashboard.py<br/>← offline HTML dashboard + search"]
    MON --> PROM["🐍 prometheus_exporter.py<br/>← optional /metrics endpoint"]
    MON --> IDB["🐍 incident_db.py<br/>← SQLite + full-text search"]
    MON --> BASE["🐍 baseline.py<br/>← time-of-day-aware thresholds"]
    MON --> FLAP["🐍 flapping.py<br/>← repeated-incident detection"]

    SCRIPTS --> INSTALL["🔧 install-watchdog.sh<br/>← one-command systemd install, dry-run by default"]

    TESTS --> TEST_PY["🐍 test_incident_env.py + test_monitor.py<br/>← 220 pytest cases"]

    DOCS --> SETUP["📄 SETUP.md"]
    DOCS --> WRITEUP["📄 WRITEUP.md"]
    DOCS --> ASSETS["🖼️ assets/<br/>← dashboard screenshot, demo mockup, Grafana JSON"]

    CI --> CIWORKFLOW["⚙️ ci.yml<br/>← tests + smoke test on every push"]

    style ROOT fill:#1e3a5f,color:#fff
    style SKILL_MD fill:#1a4731,color:#fff
    style ENV_PY fill:#3d2068,color:#fff
    style DEMO_PY fill:#7b2d00,color:#fff
    style TEST_PY fill:#2d2d2d,color:#fff
    style WATCHDOG fill:#1a4731,color:#fff
    style NOTIFY fill:#1a4731,color:#fff
    style DASH fill:#1a4731,color:#fff
    style PROM fill:#1a4731,color:#fff
    style IDB fill:#1a4731,color:#fff
    style BASE fill:#1a4731,color:#fff
    style FLAP fill:#1a4731,color:#fff
    style INSTALL fill:#7b2d00,color:#fff
    style CIWORKFLOW fill:#2d2d2d,color:#fff
Installation (Full Hermes Setup)
1. Install Hermes Agent
curl -fsSL https://raw.githubusercontent.com/NousResearch/hermes-agent/main/scripts/install.sh | bash
2. Configure Hermes
hermes setup        # Interactive setup wizard
hermes model        # Choose your model (Nous Portal recommended)
hermes gateway setup  # Connect Telegram/Discord for alerts
3. Install the Incident Commander Skill
# Copy the skill to Hermes's skills directory
cp -r skills/incident-commander ~/.hermes/skills/

# Verify it's loaded
hermes
> /skills
4. Set Up Monitoring Cron Jobs
In your Hermes conversation:
Set up incident monitoring: run a health check every 5 minutes and alert me
on Telegram if anything is P0 or P1. Send me a daily briefing at 08:00.
Hermes will install the cron jobs automatically.
5. Run the RL Training Environment (Optional)
# Install Atropos
pip install atroposlib

# Generate SFT training data
python environments/incident_env.py process --config environments/incident_config.yaml

# Full RL training (requires VLLM)
python environments/incident_env.py serve --config environments/incident_config.yaml
Reward Function (for RL Training)
The training environment uses a multi-component reward that captures real SRE quality:
pie title Reward Components
    "Resolution - Did the incident get fixed?" : 50
    "RCA Quality - Root cause explained?" : 15
    "Report Quality - Post-mortem written?" : 15
    "Skill Created - Prevention skill added?" : 10
    "Response Speed - Fast MTTR?" : 5
    "Tool Efficiency - Minimal tool calls?" : 5
Incident Scenarios (Training Scenarios)
| ID | Severity | Category | Description |
|---|---|---|---|
svc-crash-nginx |
P0 | service | nginx crashed, website unreachable |
disk-full-logs |
P1 | disk | 95% disk usage from exploded log files |
memory-leak-process |
P1 | memory | Mystery process eating 150MB+ |
docker-container-crash |
P1 | docker | Container stuck in a restart/crash loop |
k8s-pod-crashloop |
P1 | kubernetes | Pod stuck in CrashLoopBackOff |
ecs-task-crashloop |
P1 | ecs | ECS task stuck in a deploy/rollback loop |
network-unreachable |
P1 | network | Upstream dependency unreachable, timeouts spiking |
cpu-runaway-process |
P2 | cpu | 95% CPU from runaway computation |
failed-systemd-unit |
P2 | service | Custom worker service in failed state |
lambda-timeout-spike |
P2 | lambda | Lambda function timing out on cold starts |
Running Tests
# Install test dependencies
pip install pytest pytest-asyncio psutil

# Fast sanity check, no dependencies beyond the stdlib + pyyaml
python environments/incident_env.py --smoke-test

# Run full test suite (220 tests: scenarios, reward function, skill file,
# demo script, notifier incl. Teams/PagerDuty + retry/backoff + generic
# webhook w/ custom templates, watchdog dry-run/resolve wiring/
# --validate-config/notification throttling/quiet hours + still-ongoing
# notice, Prometheus exporter incl. flapping/quiet-hours gauges, incident
# search + stats + prune/archive (SQLite/FTS + CSV/JSON export), adaptive
# baseline, flapping detection + threshold suggestion, dashboard incl.
# search box + trend + clickable category charts + CSV download)
pytest tests/ -v

# Run specific test classes
pytest tests/test_incident_env.py::TestScenarioDefinitions -v
pytest tests/test_incident_env.py::TestRewardFunction -v
pytest tests/test_monitor.py::TestSafeRemediation -v
CI runs both of the above automatically on every push and PR across Python
3.10, 3.11, and 3.12 - see the badge at the top of this README or
.github/workflows/ci.yml.
Why This Project Is Worth Using
Real problem, real impact. P0 incidents cost companies thousands of dollars per minute. Shaving 30 minutes off MTTR with an autonomous agent is immediately valuable.
Uses every Hermes capability. Memory, skills, cron, gateway, subagents, session search, execute_code - all integrated into a coherent, meaningful workflow.
Self-improving. The longer Hermes runs, the better it gets at your specific infrastructure. This is Hermes's core promise - "the agent that grows with you" - demonstrated concretely.
Closes the training loop. The Atropos RL environment means this isn't just a demo - it's a path to training models that are genuinely better at agentic SRE tasks.
Works standalone, today, on a real host.
monitor/watchdog.pydoesn't need Hermes at all - justANTHROPIC_API_KEY- and is built with an explicit, documented safety model instead of giving an LLM raw shell access to your production box.Ships with working code and CI. The demo runs standalone, 220 tests pass, GitHub Actions verifies every push, and the skill file installs in one command.
Star History
Contributing
New incident scenarios, notifier integrations, and dashboard improvements are welcome - see CONTRIBUTING.md for how to get set up and what a good PR looks like, and ROADMAP.md if you want ideas. This project is meant to keep growing - if you use it and hit a rough edge, please open an issue even if you don't have time to fix it yourself.
Safety
Please read SAFETY.md before pointing anything in this repo at a machine you care about - demo mode and the watchdog have very different risk profiles.
License
MIT - see LICENSE.
Built with Hermes Agent - the agent that grows with you.